a single small particle
--Optical measurement and simulation--
Introduction
Particle measurement
Many people share a common desire to accurately observe the shape and color of minute samples using an optical microscope. In reality, the appearance is influenced by factors such as size and refractive index in a complex manner. Therefore, there are only a limited number of cases where this hope can be fulfilled. Recent advancements in technology for calculating light propagation are providing insights into this problem.
Well-known examples illustrating how shape and size impact color include the rainbow effect observed in soap bubbles and the vibrant wings of morpho butterflies. Typically, color is heavily influenced by the imaginary component of the complex refractive index. However, depending on the structure, the actual color may differ significantly from what is expected based on the complex refractive index. This phenomenon is particularly notable in the wavelength size region, referred to as the resonance region, where the structure's size plays a significant role.
Conversely, the appearance of shape and size varies depending on the complex refractive index. It is widely recognized that knowledge of the refractive index is essential for measuring film thickness. Determining the shape and complex refractive index of a minute, unknown object entails estimating these parameters based on the measured shape, size, and color information.
Resonance domain
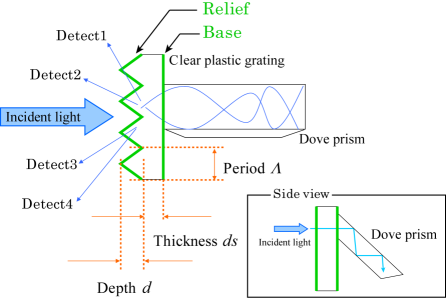
Fig. 1 Measurement of antireflective structure in the resonance domain. (Ref: Appl. Opt., 46 (2007) 648-656)
About resonance domain
If the particles are significantly larger than their wavelength and if the boundary surface with air is smooth, the transmittance and reflectance can be calculated based solely on the angle between the interface and the rays. Subsequently, it becomes possible to determine the angular distribution of the scattered light intensity. To perform this calculation, the linear approximation that assumes light travels in straight lines and the Fresnel coefficient, which provides the reflectance and transmittance at the interface, can be utilized. However, in the resonance domain where the particle size ranges from 1 to 10 wavelengths, light does not travel in straight lines but instead disperses, rendering this simple model unsuitable for calculations. Over the past 40 years, advancements in computational methods have yielded numerous rigorous techniques for assessing the distribution of the electric field near a particle and the angular distribution of scattering intensity at infinity.
-- Related papers --
1.GS White, JF Marchiando "Scattering from a V-shaped groove in the resonance domain." Applied optics" 22.15,2308-2312(1983)
2.T Nousiainen, "Impact of particle shape on refractive-index dependence of scattering in resonance domain". Journal of Quantitative Spectroscopy and Radiative Transfer, 108(3), 464-473(2007)
3.H Ichikawa "Diffractive optics in the resonance domain",OYO BUTURI 74.5 597-602(2005) in Japanese
Particle shape in the resonance domain
One of the primary methods for three-dimensional measurement is holography, which utilizes the interference of wavelengths to project a "lattice pattern" onto particles. By performing a Fourier transformation on the distorted lattice, we can easily obtain an image of the particle. The image of the holography is normal when the distortion is proportional to the width and depth of the particle. However, in the resonance domain, linearity breaks down, posing challenges in measuring particle shape. Although the scattering pattern can be used to measure the particle shape in the resonance domain, the estimation process is complex. If the shape is limited to a disc or ellipsoid, the shape can be estimated semi-analytically using the Guinier plot. To expand the range of analyzable shapes, it is necessary to establish a relationship between various shapes and their diffraction patterns. Simulation of wave optics serves as a convenient method for establishing this relationship, and it is currently experiencing rapid development.
Color of solid films and particles
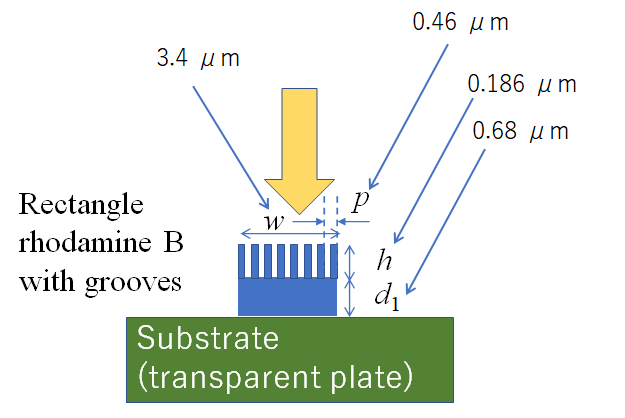
Fig. 2 Particles on a substrate with an uneven surface.(Reference: Imaging and Applied Optics Congress, Th4E 5 (2021) )
Reflection absorption spectrum of solid film and particles
When the information of the complex refractive index is obtained from the absorption spectrum, it can be calculated by combining the information of transmission and reflection. That is, the Kramers-Kronig transformation.[4,5].
However, surface unevenness and large reflections from the back surface make it difficult to use the Kramers-Kronig transformation. In this case, one method is to use the reflection of a white (zero imaginary part of the complex refractive index) sample with the same geometry as a reference for measurement [6].
In reality, frequently, there is no such reference reflectance. In many cases, only reflectance data of the sample is obtained. How can we consider its reliability?
The reflectance absorption spectrum is greatly affected by interference effects in the film (or suppression of interference) and the roughness of the surface. Knowing the degree to which these factors affect the reflectance will ensure the reliability of the data. The interference of two reflections, one from the surface and the other from the back surface, affects the reflectance. This interference effect is reduced by the wavefront of the incident light being disturbed by inhomogeneities in the film and surface roughness [7].
What if the measurement target is a particle instead of a film? In infrared absorption, the measurement of diffuse reflection is said to give information on the surface of particles. Focusing on a single particle, it turns out that it is not so simple. When vertically incident on the substrate surface, it is only necessary to consider the direction parallel to the optical axis in the film. However, in the case of particles, there is also an effect in the direction perpendicular to the optical axis.[8,9].When the difference in refractive index from air is so large that it exceeds 0.4, the unevenness of the surface has a great influence on the reflection even if the depth is about 0.2 times the wavelength if the width is about the wavelength. [7-9]. This can be discussed by the size of the sample in wavelength units and complex refractive index, regardless of wavelength.
-- Related papers--
[4]Banerjee, S., et al. "Computing complex dispersive refractive indices from thin film optical properties of materials." Novel Optical Systems, Methods, and Applications XXII. Vol. 11105. International Society for Optics and Photonics, 2019.
[5]
Jyuichiro UKON, "Analysis of reflection spectrum by Kramers-Kronig transformation" Readout Horiba Technical Reports No. 7, pp.29-38, (1993) [Original title and text in Japanese]
http://www.horiba.com/uploads/media/R007-05-029_01.pdf
https://dl.ndl.go.jp/info:ndljp/pid/3380927
[6]
Naoto Yoshida. "Basic research for non-destructive analysis of dyes by UV-visible reflection spectrum method (3) -Ultraviolet spectrum measurement of test pieces assuming dyed and woven products-." Conservation science 18.46 (2007): 75-84. [Original title and text in Japanese]
https://dl.ndl.go.jp/view/download/digidepo_10963839_po_04608.pdf?contentNo=1&alternativeNo=
[7]
T. Hoshino, S. Banerjee, S. Aoki, M. Itoh, "Reflection analysis of absorbing film with diffractive structures for incoherent light by rigorous coupled-wave analysis." Applied Optics 60.25 (2021): 7765-7771.
[8]
T. Hoshino, S. Banerjee, S. Aoki, M. Itoh. "Reflectivity Analysis of Isolated Particle on a Substrate on Incoherent Light by RCWA", Imaging and Applied Optics Congress. Washington DC, Th4E 5, 2021.7
[9]
Hoshino, Tetsuya, et al. "Design of a wavelength independent grating in the resonance domain." Applied optics 46.32 (2007): 7942-7956.
3D Shape Measurement
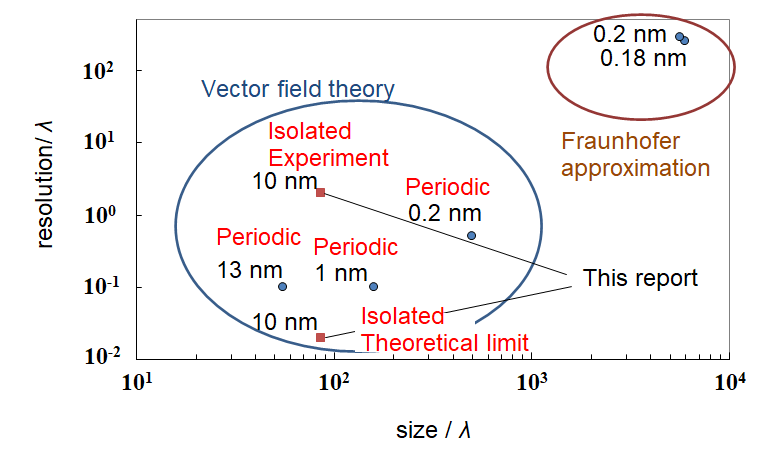
Fig. 3 Particle size and resolution of soft X-ray 3D measurement. The measurement wavelength is shown to the left of each point.(Reference: Applied Optics 59.28 8661-8667(2020). )
Impact of analysis methods on optical 3D measurement
One-shot three-dimensional optical measurement can be roughly divided into those that utilize the fact that Fourier transform is possible in Fraunhofer approximation or the first-order Born approximation and those that are based on vector field theory that solves Maxwell's equations strictly by numerical calculation. , Holography, and phase recovery are typical examples of Fraunhofer approximation. By ignoring the distortion of the wave surface due to the unevenness of the wavelength level on the sample surface, the accuracy worsens, but the image is obtained directly at high speed. Also, when the difference in refractive index between the sample and the medium is small, the distortion of the wave surface can be ignored, so high-resolution measurement is possible.[10, 11].
On the other hand, a typical example of light measurement based on vector field theory is light wave scattering measurement (scatterometry). It solves a problem called the inverse problem of estimating the original image from the scattered light angle distribution. The target is trapezoidal or elliptical. However, since the measurement is performed by actively utilizing the distortion of the wave surface, the target particle size and resolution are two orders of magnitude smaller than the Fraunhofer approximation.[12,13]. We have extended the measurement target from periodic structures to isolated systems (Fig. 3), opening up the possibility of general-purpose measurement[12,14,15].
-- Related papers--
[10]Born, Max, Emil Wolf, and A. B. Bhatia. "Principles of Optics, seventh (expanded) ed." Cambridge U. Press, Cambridge, UK, 695-734(1999).
[11]Takashi Ikuta. "Three-dimensional imaging characteristics of imaging optics." Microscope 44.2 (2009): 121-129.
https://www.jstage.jst.go.jp/article/kenbikyo/44/2/44_121/_pdf/-char/ja [Original title and text in Japanese]
[12]Hoshino, Tetsuya, et al. "High accuracy cross-sectional shape analysis by coherent soft x-ray diffraction." Applied Optics 59.28 (2020) 8661-8667.
[13] Hoshino, T., Shiono, M., Banerjee, S., Aoki, S., Sakurai, K., and Itoh, M. (2022). Assessment of High Accuracy 3D Shape Analysis. Research Developments in Science and Technology 5, 100-113.
[14] T. Hoshino, N. Watanabe, S. Aoki, K. Sakurai, and M. Itoh “Cross-sectional particle measurement in the resonance domain on the substrate through scatterometry,” Opt. Express, 25 (2017) 26329-26348.
[15] Hoshino, T., Aoki, S., Itoh, M., Shichiri, M., and Itoh, H. (2022, August). Scatterometry of isolated resist pattern by soft X-rays using deep-learning analysis. In Digital Holography and Three-Dimensional Imaging, W5A-20. Optica Publishing Group.
Paper list
Measurement of 3D shape and reflection absorption spectrum of a single particle
2021
- Tetsuya Hoshino, Banerjee Saswatee, Sadao Aoki, and Masahide Itoh, "Reflection analysis of absorbing film with diffractive structures for incoherent light by rigorous coupled-wave analysis,"Appl. Opt. 60, (2021) 7765-7771.
2020
- Tetsuya Hoshino, Masahiko Shiono, Banerjee Saswatee, Sadao Aoki, Kenji Sakurai, and Masahide Itoh, "High accuracy cross-sectional shape analysis by coherent soft x-ray diffraction," Appl. Opt. 59, (2020) 8661-8667.
- Tetsuya Hoshino and Takaaki Fukamizu and Sadao Aoki and Masahide Itoh, "Quasicrystal hole array as X-ray focusing optical element," Appl. Phys. Express 13(10) (2020) 102004.
2017
- T. Hoshino, N. Watanabe, S. Aoki, K. Sakurai, and M. Itoh “Cross-sectional particle measurement in the resonance domain on the substrate through scatterometry,” Opt. Express, 25 (2017) 26329-26348.
2016
- T. Hoshino, T. Yatagai, and M. Itoh: “Optical Memory Model of the Human Brain ” Chapter 7. In: Spatial, Long-and Short-Term Memory: Functions,Differences and Effects of Injury. Nova Science Publishers, Inc. (2016) 115-132.
2015
- T. Hoshino and M. Itoh: “Cross-sectional shape evaluation of a particle by scatterometry.,” Opt. Commun., 359 (2016) 240-244.
Rigorous simulation considering polarization
2013
- T. Hoshino, T. Yatagai, and M. Itoh: “Scatterometry of Slant Incidence to Isolated Scatterers for High-Density Memory.,” Jpn. J. Appl. Phys., 52 (2013) 09LA05.
2012
- T. Hoshino, T. Yatagai, and M. Itoh: “A Columnar Model Explaining Long-Term Memory,” Optical Memory and Neural Networks(Information Optics), 21(4) (2012) 209-218.
- T. Hoshino, T. Yatagai, and M. Itoh: “Precise and rapid distance measurements by scatterometry,” Opt. Express, 20 (2012) 3954-3966.
Wavelength dependency
2011
- T. Hoshino, S. Banerjee, J. B. Cole, M. Itoh, T. Yatagai: “Shape analysis of wavelength-insensitive grating in the resonance domain,” Opt. Commun., 284 (2011) 2466-2472.
2009
- T. Hoshino, S. Banerjee, M. Itoh, and T. Yatagai: “Diffraction pattern of triangular grating in the resonance domain,” J. Opt. Soc. Am. A, 26 (2009) 715-722.
2007
- T. Hoshino, M. Itoh, and T. Yatagai: “An antireflective grating in the resonance domain for displays,” Appl. Opt., 46 (2007) 648-656.
- T. Hoshino, S. Banerjee, M. Itoh, and T. Yatagai: “Design of a wavelength independent grating in the resonance domain,” Appl. Opt., 46 (2007) 7948-7962.
Revision History
- 2017.1.1 Add menu bar 3rd
- 2016.11.29 Japanese version is added 2nd
- 2016.11.3 Transferred from NIFTY 1st